![]()
![]()
![]()
![]()
![]()
![]()
![]()
![]()
![]()
![]()

"It is
impossible for ideas to compete in the marketplace if no forum for
their presentation is provided or available." � �Thomas Mann, 1896
Physical Level
Systems Design:
The ignored
component of Systems Analysis
& Design Training
Authors:
L. Jane Park Ph.D., CPA., Professor of Accounting
and Paul H.
Rosenthal, PhD, Professor of Information Systems
Contributed by California State University, Los Angeles
Abstract
This paper presents a recommended information system physical level design theory and charting methodology for use in System Analysis and Design training that is designed for student comprehension and rapid programmer implementation. It also includes a discussion of Transaction Processing Systems applications (TPS) which make up the majority of administration oriented multi-million dollar projects, but are given little attention in systems analysis and design training perhaps due to their complexity.
1. Introduction
Fifty years of designing information systems has created a wide variety of charting methodologies for the logical and physical level design of TPS, management information systems (MIS), decision support systems (DSS), executive information systems (ESS), and office automation systems (AOS). Logical level design of Transaction Processing Systems (TPS) applications has normally used the same tools as these other applications; however their physical level design is much more complex because of their extensive batch processing and manual systems requirements. This paper will therefore discuss TPS applications physical design since their complex structure requires a more flexible and complex physical level design methodology than other types of business applications.
Prior to the description of a recommended physical design methodology for inclusion in our systems analysis & design training, a discussion of TPS follows that will highlight the importance and complexity of these systems.
2. Structure of Transaction Processing Systems
Figure 1 presents the typical overall scope of an administrative-oriented TPS application. It shows the interrelationships of core TPS online and batch processing with its dependant MIS, DSS, ESS, and interfacing systems. In fact, successful implementation of large scale multimillion dollar TPS systems requires the integrated logical and physical level design of all the elements shown. Perhaps its time for systems analysis and design training to also present the true scope and complexity of the modern integrated transaction processing applications shown in Figure 1.
3. Creating a TPS Physical
Design
Most logical design level TPS structured design is data flow diagram (DFD) based, since typically the data is simple in structure and independent from the procedural modules because of the need for sharing of data between applications. Complex entity relationship diagrams (ERD) based design methods are therefore seldom required for TPS systems. At the physical design level however, no predominate structured design approach has appeared.
This paper proposes a TPS physical design approach that is easily understood by users, and easily used by programmer analysts during implementation. For TPS, a physical design is created from a DFD based logical design, by separating processes and data stores by time (daily vs. monthly, day vs. night ...), place (client or server, centralized vs. distributed...), online vs. batch, and manual vs. automated. None of these design decisions are fully illustrated in any of the textbook examples shown later in this paper. Additionally, proper separation of data flow vs. paper flows, and people's actions vs. computer processes is almost never maintained.
Figure 2 presents an overall physical design approach of a country club restaurant using VISIO available symbols. The application is modularized across time and should allow programmers to produce a well structured program. Students presented with this type of chart have been able to easily create the four detailed program designs needed to implement the system. This level of physical charting is the recommended step needed between logical designs and programming.
The type of charting shown in Figure 2 or its equivalent should be included in all systems analysis and design training. The texts should illustrate physical level design to the point where an implementation team can start program design, and use the picture type symbols shown since users and managers can read them.
The closest methodology to that shown in Figure 2 is a "distributed systems architecture" approach presented in Whitten (page 509) His approach to modeling the application architecture of an information system states that
"The use of logical DFD's to model process requirements is a fairly accepted practice. However, the transition from analysis-oriented logical DFD's to design oriented physical DFD's has historically been somewhat mysterious and elusive. We desire a high-level general design that can serve as application architecture for the system, and as a general design for the processes that make up the system. At the same time, we don't want to get caught up in a counterproductive modeling exercise that slows our progress in system design and rapid application development. Simply stated, we want a blueprint to guide us through detailed design and construction. The blueprint will identify design units for detailed specification or rapid system development, which ever is most productive in our project." (Whitten, pages 529-530)
Whitten's methodology of producing 1) a network architecture, 2) a data distribution and technology assignment, 3) process distribution and technology assignments, and 4) person/machine boundaries is applicable to this paper's methodology if care is taken to consider time, place, network structure, batch processing and other physical level requirements.
The key factor in producing a useful physical design is the ability both for users to understand the true scope of the system and for the implementation team to be able to use it for program, data, and interface design. That level of charting should to be illustrated in systems analysis and design training. Figure 2 demonstrates that level of physical design.
Figure 2:
Physical Level Design Example (Restaurant)
4. Comments of current textbook Physical Design Charting examples
This section includes an example of a high level logical design and an example of a middle level physical design from two popular systems analysis and design texts. They illustrate the simplification trend of charting examples that have made it so difficult for our students to easily learn to create programmable designs.
Figures 3a and 3b illustrate this problem. Figure 3a is an illustration of a TPS application combing online and batch processing from Shelly et al. It omits the basic concept of differences in time fundamental to the separation of these processes. Figure 3b inserts this concept as well as the idea of a trigger. It may actually be easier to understand than the simplified figure 3a.
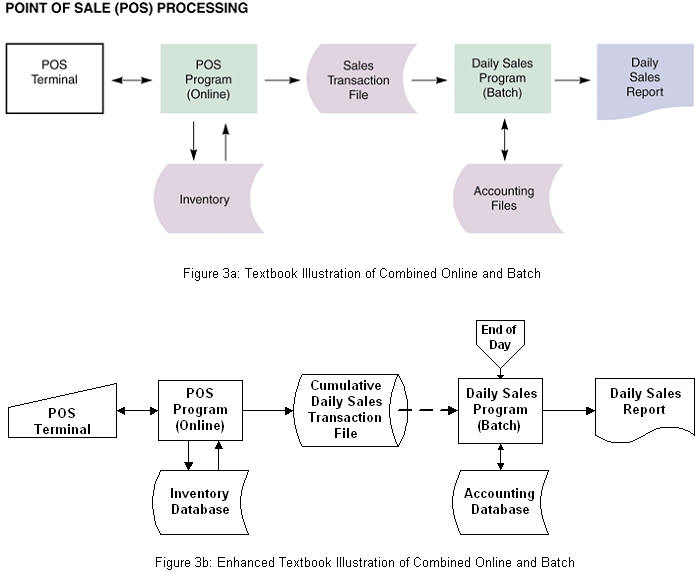
Figure 4a and 4b also illustrate this simplification problem. Figure 4a illustrates an automated teller machine's (ATM) processing from Langer (page 72). It omits several key functions including the start and stop steps, as well as not defining the differed manual and automated activities shown in Figure 4b. It is simply incorrect in form and function and misleading to our students.
5. Summary
The author has used several of the system analysis and design textbooks listed in the following annotated bibliography with mixed results. When using a fairly complex TPS for say a country club as a design project, several class sessions are required before the students can start detailed program and manual procedure design. This is caused by the lack in the texts of procedures suitable for true TPS applications. Therefore, the authors have developed the methodology shown in this paper to supplement the texts approach. The key to its effectiveness (as illustrated in the Figure 2 example) is the inclusion in the design of both manual and automated procedures and the separation of processes by time and place of actions. This type of charting appears to save several weeks of frustrating student work, and is therefore recommended.
6. Annotated Bibliography
This section includes a listing of selected System Analysis and Design books including comments on their system level (not program logic level) coverage of transaction processing systems (TPS), logical level processing design charting, and physical level processing design charting.
Dennis, A., Wixom, B. H., and Roth, R. M. (2006). Systems Analysis & Design: Third Edition. John Wiley & Sons, Inc.
Batch processing is introduced for data input and report preparation. Combines logical and physical design using DFD and Structure Charts.
Hoffer, J. A., George, J. F., and Valacich, J. S. (2005). Modern Systems Analysis and Design: Fourth Edition. Pearson Prentice Hall.
No discussion of batch processing. Physical design consists only of the incorporation of software, processing and network technologies.
Langer, Arthur M. (2001). Analysis and Design of Information Systems: Second Edition. Springer-Verlag, New York.
Only a historic view of transaction and batch processing systems. Uses DFD and Object charting symbols.
Pressman, Roger S. (2004). Software Engineering: A Practitioner�s Approach: 6 Edition, McGraw-Hill Companies, Inc.
The leading advanced systems analysis and design textbook�s illustrations are at the programming level for mechanization type applications.
Satzinger, J. W., Jackson, R. B., and Burd, S. D. (2005). Object-Oriented Analysis and Design with the Unified Process. Thomson Course Technology, Boston.
Has a program logic level orientation.
Shelly, G. B., Cashman, T. J., and Rosenblatt, H. J. (2006). Systems Analysis and Design: Sixth Edition. Thomson Course Technology, Boston.
Separates enterprise computing and transaction processing systems; discusses both online and batch analysis and design; logical design includes primarily interface and data structures; physical design covers very limited scope online and batch processes.
Whitten, J. L., Bentley, L. D., and Dittman, K. C. (2004). Systems Analysis and Design Methods: Sixth Edition. McGraw-Hill Irwin.
Presents a detailed online oriented physical design methodology. The physical data flow diagram method demonstrates 1) network architecture, 2) data distribution and technology assignment, 3) process distribution and technology assignment, and 4) person/machine boundaries. No illustration of batch physical design.
For
Further Information
Contact
Dr. Paul Rosenthal
Information Systems Department, ST603
California State University, Los Angeles
5151 State University Drive
Los Angeles, CA 9032-8123
[email protected]
The Business Forum
Beverly Hills, California, United States of AmericaEmail: [email protected]
Graphics by DawsonDesign
Webmaster: bruceclay.com
� Copyright The Business Forum Institute - 1982 - 2015 ** All rights reserved.
The Business Forum Institute is not responsible for the content of external sites.